|
метод ГРВ профессора К.Г. Короткова |
|||||||||
|---|---|---|---|---|---|---|---|---|---|
Vainshelboim A. *, Momoh K.S. *, Korotkov K. **, Shigalev V . ***, Beljakov V . *** , Korenugin D . G . ***
Observing the Behavioral Response of Human Hair to a Specific External Stimulus Physical Separation Using Dynamic Gas Discharge Visualization observed with Corona Discharge Analysis
*Aveda Corporation, Blaine, Minnesota USA; ** State University SPITMO, St. Petersburg, Russia; *** State Politechnical University, St. Petersburg, Russia.
• Introduction
While the hair root is a vital, its product, the hair shaft, is primarily dead keratinized , dead cells [Zviak, 5]. [1, 2] . Hair has traditionally been considered to be an inert tissue. Its direct interaction with the body has been commonly believed to be nonexistent. Initial experiments using the technique of Gas Discharge Visualization (GDV) [3, 4] on human hair raised important questions about the nature of the physical connection between hair and scalp.
GDV has shown promise in multiple areas. These areas can be divided into two major categories. The first is testing of biological and/or physiological responses in vivo of humans overall body states using data from the fingertips [Ref Korotkov, p.XXX NIH]. The second is direct testing of materials, both liquid and solid. Promising results have been seen in testing of liquids, especially aqueous solutions [ref Bell], oils and weakly conducting electrolyte solutions . [ Ref Korotkov] . A variety of experiments have been performed on human tissue, including blood [ ref Korotkov]. It is then conceivable that hair would be an appropriate setting for Dynamic GDV testing.
Our The initial experiments tested the hair on live models, along with testing swatches single-sourced from their hair. both while it was attached to their h ead and subsequently after cutting. The results of these GDV tests showed significant differences between hair in vivo in vivo and in vitro in vitro .
• Experimental
The GDV test equipment consists of 3 major parts. The first is a coil, which along with a glass electrode on which the test material is placed with conductive layer at the bottom forms a circuit that creates the corona discharge. The second part is a digital video camera. The third part of the GDV test equipment is software to analyze and quantify visual parameters of the real-time fluctuations of corona discharge such as brightness, area, and shape. The analysis of these video files is known as Dynamic GDV.
A train of triangular bipolar 10 microsecond electrical impulses of 3 kV, at a steep rate of 10 6 V/s and a repetition frequency of 10 3 Hz, was applied to the conductive layer, generating an electromagnetic field (EMF) around the hair. The hair produced a a burst of electron-ion emission and optical radiation light quanta corona discharge , in the form of a sliding gas discharge along the glass dielectric surface , with radiation in the visual and ultraviolet light regions of the electromagnetic spectrum. A spatial distribution of discharge channels was registered via glass plate by the optical system with the Charge Coupled Device TV Camera, and then it was digitized in the computer. Hair were exposed to an EMF for 10 seconds, and short ōfilmsö were recorded in the computer as ōAVIö files. The frame rate (frequency of record) was set at 30 images per second, as dictated by the speed of the camera/ computer interface. All ōAVIö files were converted into a series of ōBMPö files, and the area (the number of light-struck pixels) and averaged intensity (ranked from ō0ö for absolute black to ō255ö for absolute white) parameters for every image were calculated by the software. The time series was averaged on 10 measurements that provided the statistical reliability at the confidence level of 0.95 with an experimental sensitivity of 75%.
The entire experimental setup was placed in a sealed chambe r that allowed control of air pressure, humidity and temperature .
Hair samples were exposed to the EMF for 10 seconds, and video footage was recorded as .avi files. The frame rate was set at 30 frames per second . All . avi files were converted into a series of BMP files, and the area (number of light-struck pixels) and averaged intensity (relative brightness ranked from 0 for absolute black to 255 for absolute white) for every image were calculated by the software. The time series was averaged on 10 measurements that provided the statistical reliability at the confidence level of 0.95 .
The reproducibility of the method was verified by measuring the time dynamics of the gas discharge around a metal cylinder that was 10 mm in diameter, and was placed in the center of the optical lens.
Further analysis is done with common statistical software. Results plotted, , are and , analyzed and plotted using a 95% confidence interval , and plotted for comparison . The results from a 30-second video clip are plotted on a grid showing the readings from each of the 300 frames as a dynamic curve. Dynamic curves from separate trials can be compared to determine whether there are statistically significant differences between them. Trends over time can also be compared.
GDV trials on hair in vivo in vivo were performed under controlled humidity and temperature levels: 33-38% RH relative humidity (RH) , normal barometric pressure and 68-72 degrees Fahrenheit. A clamping system was developed to spread hair in a wide, shallow ōsheetö in a plane parallel to the surface of the GDV camera's electrode. Control swatches were single-sourced, assembled by International Hair Importers and Products, New York USA from hair that was collected during our the tests. Mannequin heads, both single-source and multiple-source, were obtained from Pivot Point International Incorporated, Illinois USA. Over 100 swatches, tresses, mannequin heads and other control samples were used as hair controls.
The panel of subjects consisted of 14 adults ages 18-55. They represented a variety of hair types; with damage levels ranging from virgin hair, to hair that had been treated or styled extensively. Test subjects sat near the camera so that their hair could pass completely across the electrode. An initial ten-second reading was taken with their hair on the electrode. A few minutes later, a 30 second reading was taken ; at the 15-second mark , during which the hair was cut between the electrode and the subject, detaching the hair from the subject. The cut was made in a manner to ensure that the sample did not move on the electrode. The GDV parameter of Intensity was used as the main measurement. GDV Area measurements were used as a control to ensure the dimensions of the sample and its position were consistent during the entire duration of the experiment.
Figure 2 . Cutting of live model's hair during GDV test. Electrode is under circular black cover. For the first group four test of test subjects, or ōGroup 1,ö testers used a varying schedule was used for taking readings of the hair. In some cases, tests concluded after 24 hours of testing; in others, a schedule of readings over 3 days was followed.
Due to trends seen in the results f rom these four subjects or the first group , two additional subjects were tested using the same protocol, but but with a longer schedule of with readings taken over a 7-day period . An example of a dynam ic GDV image from this test is shown in Figure 3. This group will heretofore be referred to as ōGroup 2.ö The intervals after the initial cut were, in one case, two hours after cutting, 24 hours, 98 hours, 121 hours, 165 hours. In the other case, the intervals were two hours, 24 hours, 96 hours, 120 hours, 144 hours, and 165 hours.
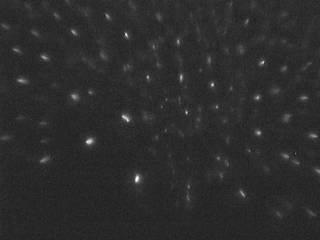
Figure 3. Video frame from a 30-s econd dynamic GDV test (900 frames total ) showing corona discharge from hair situated parallel to camera lens. Note glow emanating from individual hair fibers at points along their length.
A control was provided by testing a commercial single-sourced hair swatch. Set-up for the experiment matched that of the live subjects, with special care being taken to avoid disturbing the sample's alignment on the electrode during cutting. Readings on this subject were taken after cutting at several intervals over a three-week period.
A sample of hair about ½ 4 inch es long was cut from the back of a live model's the head at the distance about 2 inches from the scalp. The swatch was immediately placed inside a Teflon tube with 3-4 mm of hair protruding from the bottom. The end cross-section cut was performed using a microtome to ensure uniformity . The holder positioned the swatch vertically on the perpendicular to the electrode of the GDV Camera with the uniformly cut ends of the individual hair touching the glass.
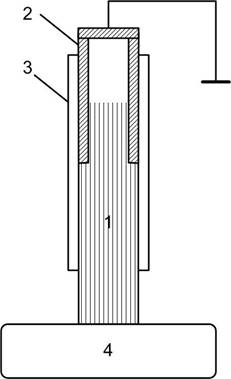
Figure 1 4 . Schematic diagram of GDV device for testing hair in experiment 2 . 1: Swatch of hair; 2: metal tube; 3: Teflon tube; 4: GDV electrode.
Using this setup, hair was tested at precisely measured specific humidity levels using a sealed chamber specially designed for the purpose. Temperature, humidity and barometric pressure and were kept constant.
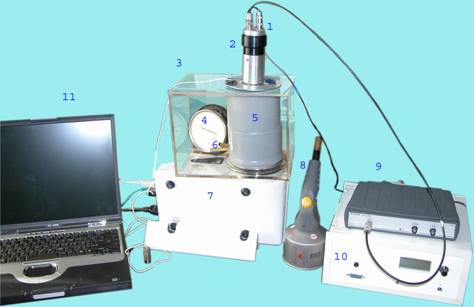
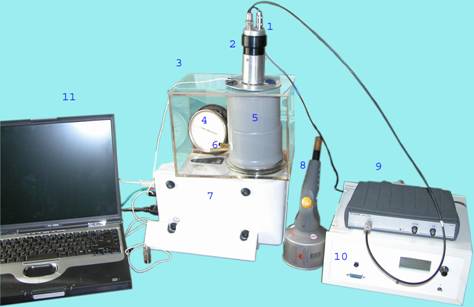
Figure 5 . Experimental setup for humidity experiments. 1. UV Photomultiplier 2. EMF shielding cover 3. Main chamber 4. hygrometer 5. Sealed GDV chamber containing electrode; 6. Gas tubes 7. GDV Camera 8. Drier Dryer with silica gel 9. Digital oscilloscope 10. Photomultiplier power source 11. Computer
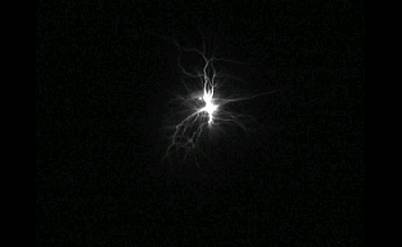
Figure 6 . Image of corona discharge from hair bundle in Experiment 2 . Hair is positioned perpendicular to the lens. Circular shape of hair bundle is Bottom cross section of sample visible as a faint circle at the center of image.
• Results & Discussion
In experiment 1, we examined how hair behaved in GDV testing hair was tested both in vitro in vivo and in vivo in vitro . We also tested Tests were also performed to see what effect, if any, cutting had on the measurements from a sample. The hair of the test subjects showed a GDV response on both was tested for the GDV area and intensity parameter . The GDV area parameter was used as a control to standardize the amount of hair in each test.
An initial time series of intensity readings was taken of each model's hair to provide a baseline. Afterward, each model's hair was cut , t aking care not to disturb the position of the hair on the electrode. . Seeing a change in GDV intensity readings upon cutting the hair , we changed the protocol to allow us to examine , as shown in Figure 1 above, the protocol was changed to allow the observation of this phenomenon over an extended period of time. First and foremost, our These experiments were aimed at finding whether this effect was consistent and reproducible. In all 13 models, the initial 30-second time series included the act of cutting the hair, which was timed to occur halfway through the 30-second test. at the 15-second mark of the 30-second test ( f ig . 1) .
Following the initial 30-second test, which incorporated the cut, 10-second r eadings were taken at 24, 98, 121, and 165 hour s . The averaged readings from each series were plotted together to show the change in the intensity reading over time ( fig . 2) .
The results shown in Figure 2 indicate a significant drop in intensity occurred in the first 24 hours after cutting the hair from the head. The measurements taken after the 121-hour test did not differ significantly from each other. This means that the decline in the hair's ability to respond to the EMF involved in the GDV testing was largely complete by the forth day after cutting.
|
Fig.1. Time dependence of the image intensity in 30 second reading with hair cut from the model midway through the reading (this moment is shown by the arrow )
|
 Figure 8 shows the corona discharge seen in hair still attached to the scalp along with an image of the corona discharge in the same sample of hair more than 3 days after cutting. There is a clear difference in the GDV signal registered from the sample over this time period.
Figure 8. GDV effect registered in hair. Image at left is hair still attached to head; image at right is hair 3 days, 19 hours after cutting. Color palette has been optically inverted for viewing.
F igure 2 . Results of the GDV intensity parameter for each of several intervals for a single subject.
Figure 8. Optically inverted images of GDV effect in hair. Image at left is hair still attached to head; image at right is hair 3 days, 19 hours after cutting. .
The results of the subject shown in Figure 3 were confirmed by the results from other test subjects. The intensity readings from all live models on the GDV intensity parameter were plotted against time , showing a general trend of decreasing intensity. This decrease is most extreme immediately after cutting, and slows after 24 hours. This pattern of decline, the magnitude of which quickly decreases, can be described by a logarithmic trend. After this the initial reading, similar 30-second time series were measured at specific intervals. These intervals were more frequent in the first 1 hour after cutting; afterward, samples were measured at 12 , 24 or 48-hour intervals. The averaged readings from each series were plotted together to show the change in the intensity reading over time.
Presented results were reproduced on many samples in two laboratories both in Russia and in the USA . Of course this is only a preliminary data and it is difficult to make any conclusions. We may assume that
It appears that the P p hysical damage done to the hair by cutting the transmission of ?-electrons along the hair root is clearly affected by the physical separation from the body. This may be due to the separation of the hair from the body, a possible source of free electrons for the generation of corona discharges. It is well known that GDV can register subtle variations in electron availability [ ref JAP [5] , ], and this availability is easily affected by changes in the complexes that transmit energy potentials through tissue . [ [6] . Ref JACM KK ] It was postulated that the keratinized bulk of human hair, commonly believed to be comprised of dead cells, is in fact an active transmitter of electromagnetic signals.
If such a communication did exist between human hair and the body, this signal would be expected to eventually dissipate weaken after interruption of this connection.
Control experiments based on in vitro in vitro samples (hair swatches), did not reveal the same change in GDV signal , as experienced was observed with the in vivo in vivo samples.
Hair cut ¢ 15 seconds (frame 451)
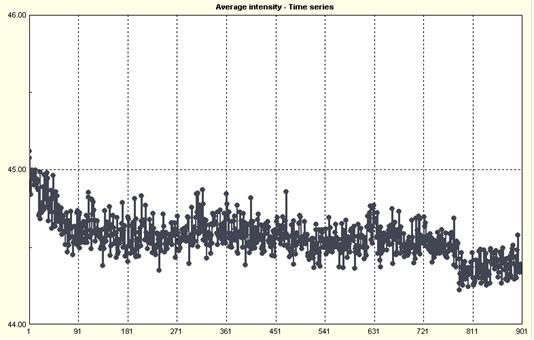
Figure 11a. 30-second test showing intensity values for a commercial single-source hair swatch. Cutting was performed at frame 451.
Figure xxx 11 illustrates the time-series study of a hair swatch , including readings taken before and after cutting. which includes before, during, and after cutting. Hair swatches used in this study were commercially single-sourced in order to reduce inherent variations within measurements. No statistically significant difference was seen in the readings for the swatch after cutting from the mannequin head.
[Insert picture ōfigureö here].
[Comparisions of live sample vs. swatch].
Average Results of Time Series over Extended Time
Figure 11 b . Chart showing readings from swatch over several days. Note that even after 6 days, the levels are statistically undistinguishable.
GDV intensity measurements for each 30-second time series were expressed as an average value in order to allow for quantitative analysis. When viewing the average value for each test plotted over time, a gradual dissipation of the GDV potential becomes apparent. Initial 30-second time series (taken before, during, after cutting) have shown some sort of immediate response to cutting. If there is no signaling in between hair and body, these changes will not occur.
The potential would not dissipate, and the averages would be similar to those of single-sourced hair swatches. They will be attributed to environmeIt was not known what would happen to the signal of the freshly cut hair over time.but they didn't show what happens to signal dissipation
When averaging the readings from the live models, we see that the trend seen in figure xx h olds. .
Conclusions: Experiment 1 1
As stated previously, the live model panel included a diverse array of test subjects: both male and female with ages ranging from 18-55. Additionally, a variety of hair types ranging from very healthy (virgin) to heavily damaged (both mechanically and chemically) were encountered during the study. It should be noted that while the majority of panelists were Caucasian, the panel consisted of a wide range of hair levels (shades). Additionally, some Some panelists exhibited up to 50% gr e y hair coverage. In every test subject, an immediate reaction to cutting was observed, using the dynamic GDV parameter, intensity. This suggests a direct connection from the body to the hair has been disrupted during the cutting procedure. susbsequent subsequent liove live
While further investigation of this phenomena this phenomenon is needed, this disruption was not dependent on a certain test subject attribute (i.e. age, sex, hair level, greyness ) . The character of dynamic curves encompassing before, during, and after cutting, indicates a clear, definite, immediate change corresponding to the exact time of cutting. This phenomena ; nor was it was not observed on the in vitro , single-sourced hair, which was tested under exactly the same environmental conditions and cutting procedures of the live models. These results indicate no disruption of signal has occurred within the sample. These results support the hypothesis of transmission of signals between human hair and body, possibly centered around the polypeptide composition of hair, including specific amino acids, most notably cysteine, serine, and glutamic acid.
A second possible mechanism describing the transmission of these signals is by means of bound molecules of water found within the human hair. If water is not present (i.e. 0% humidity), and a GDV response is still measurable, this would eliminate this possible explanation. The second set of experiments in this paper investigate this theory. In either case, prolonged studies after cutting were needed to observe whether this signaling is due strongly influenced to any kind of by external environmental influence, or if the diminished measured response was is an actual attribute of the observed phenomena. independent phenomenon.
Effect of cutting the Hair Samples
Cutting the hair samples had a visible effect on two of the samples from live individuals. The average intensity dropped by 0.25 to 1.0 units for the remaining 15 seconds of the test. Interestingly, these were the two samples comprising Group 2. In Group 1, and in the hair swatch, no statistically significant difference in intensity at the moment of cutting was detected. However, four of the six samples showed a higher activity level at the end of the 30-second cutting period than they did at the beginning.
In two of the four samples in Group 1, the intensity of the effect actually rose over the hour immediately after the cutting. This rise was statistically significant ¢ in one case subject DD, by 1.14 units, and in subject Pam, by 1.0 units.
• Decrease in intensity over time ¢ Group 1
Samples in Group 1 showed a variety of trends on the curves showing the decline of the GDV effect. In many cases, readings over this period showed that values between readings in many cases were not statistically significant. However, in all cases, GDV activity remained well above the blank reading.
• Decrease in intensity over time ¢ Group 2
Due in part to the similarity between the values shown in these curves, the decision was made to test new subjects over a longer period of time. These subjects, tested after roughly one day, four days, five days, and seven days, showed two different results. In one sample, the intensity dropped significantly after one day, and then remained at or slightly below that level for the rest of the testing. In the other sample, the decline over the testing period was slow but continuous; however, a reading at two hours was lower than all but the last reading.
• Comparisons with Controls
As noted above, intensity readings on each subject were significantly higher than the blank readings in all cases.
The other type of control was the hair swatch, used to provide a comparison to the live subjects. Interestingly, the swatches' initial intensity readings were not significantly different than those of the live samples. They differed from the ōblankö readings by the same amount as did the samples from live subjects.
1. C. Zviak, Ed. , The Science of Hair Care . Marcel Dekker , New York , 1986 .
2 . C. Robbins, Chemical and physical behavior of human hair . Springer, New York , 1994 .
3 . Measuring Energy Fields: State of the Science : GDV Bioelectrography series Vol . I , K. G. Korotkov , Ed., Backbone Publishing Co. Fair Lawn, USA, 2004 .
4. K. Korotkov, D. Korotkin, J. Appl. Physics 89, 4732 (2001) .
5 . K. Korotkov et al., J. Appl. Physics 95, 3334 (2004).
6 . K . Korotkov , B. Williams , L.A. Wisneski , J . Altern. Complement. Med 10 , 49 ( 2004 )
|
|
|---|

